Average Car Age & Vehicle Ownership Statistics 2026 (US)
How old is the average car in the US in 2026? Vehicle age, registrations, miles driven, new car prices and ownership costs, all from primary sources.
Last updated: October 13, 2026 · By the RimFit team · Every number links to the organisation that published it.
How old the cars on US roads are, how many there are, how far they go and what they cost to own. These are the 2026 numbers, each one taken from the organisation that published it.
Key takeaways
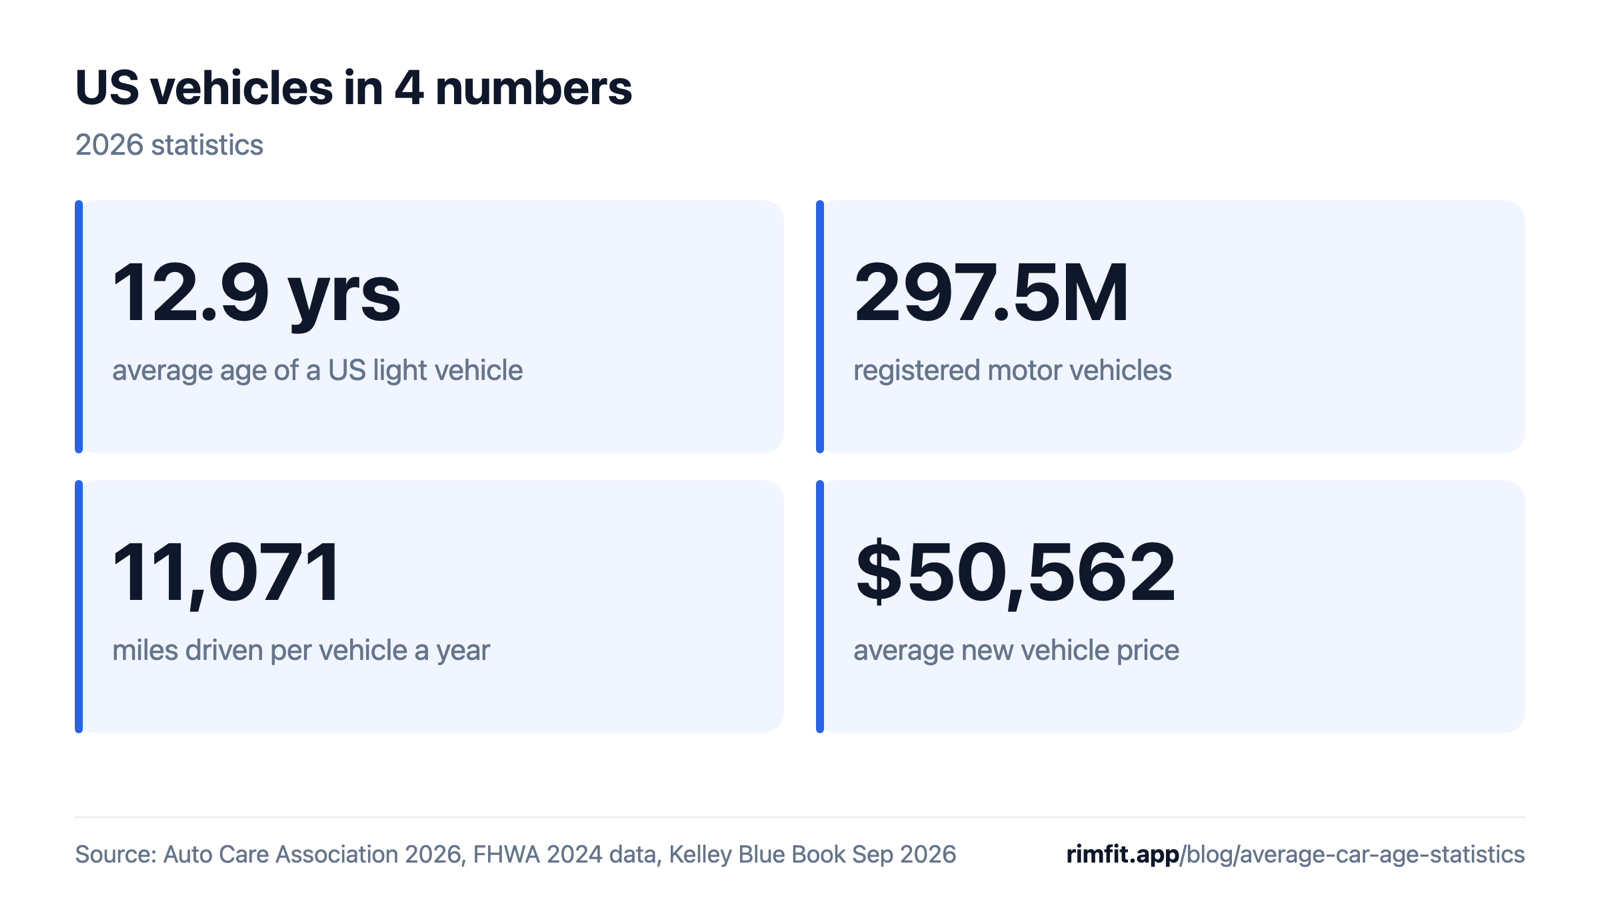
- The average US light vehicle is a record 12.9 years old. (Auto Care Association, 2027 Auto Care Factbook, Jun 2026)
- Passenger cars average 14.5 years and light trucks 11.9 years. (S&P Global Mobility, May 2025)
- 297.5 million motor vehicles were registered in the US in 2024. (FHWA Highway Statistics 2024, Table MV-1, Jan 2026)
- Trucks, including pickups and SUVs, are about 64% of registered vehicles. (RimFit calculation from FHWA Highway Statistics 2024, Table MV-1, Jan 2026)
- California has the most registered vehicles: 30.9 million. (FHWA Highway Statistics 2024, Table MV-1, Jan 2026)
- Americans drove 3.29 trillion miles in 2024. (FHWA Highway Statistics 2024, Table VM-1, Feb 2026)
- The average vehicle is driven 11,071 miles a year. (FHWA Highway Statistics 2024, Table VM-1, Feb 2026)
- There are 239.8 million licensed drivers. (FHWA Highway Statistics 2024, Table DL-22, Feb 2026)
- A new vehicle averaged $50,562 in September 2026. (Kelley Blue Book / Cox Automotive, Oct 2026)
- Owning a new vehicle costs $12,863 a year. (AAA, Your Driving Costs 2026, Sep 2026)
- The light-vehicle fleet is forecast to pass 301 million by 2029. (Auto Care Association, 2027 Auto Care Factbook, Jun 2026)
How old is the average car in the US?
The average US light vehicle is a record 12.9 years old in 2026.
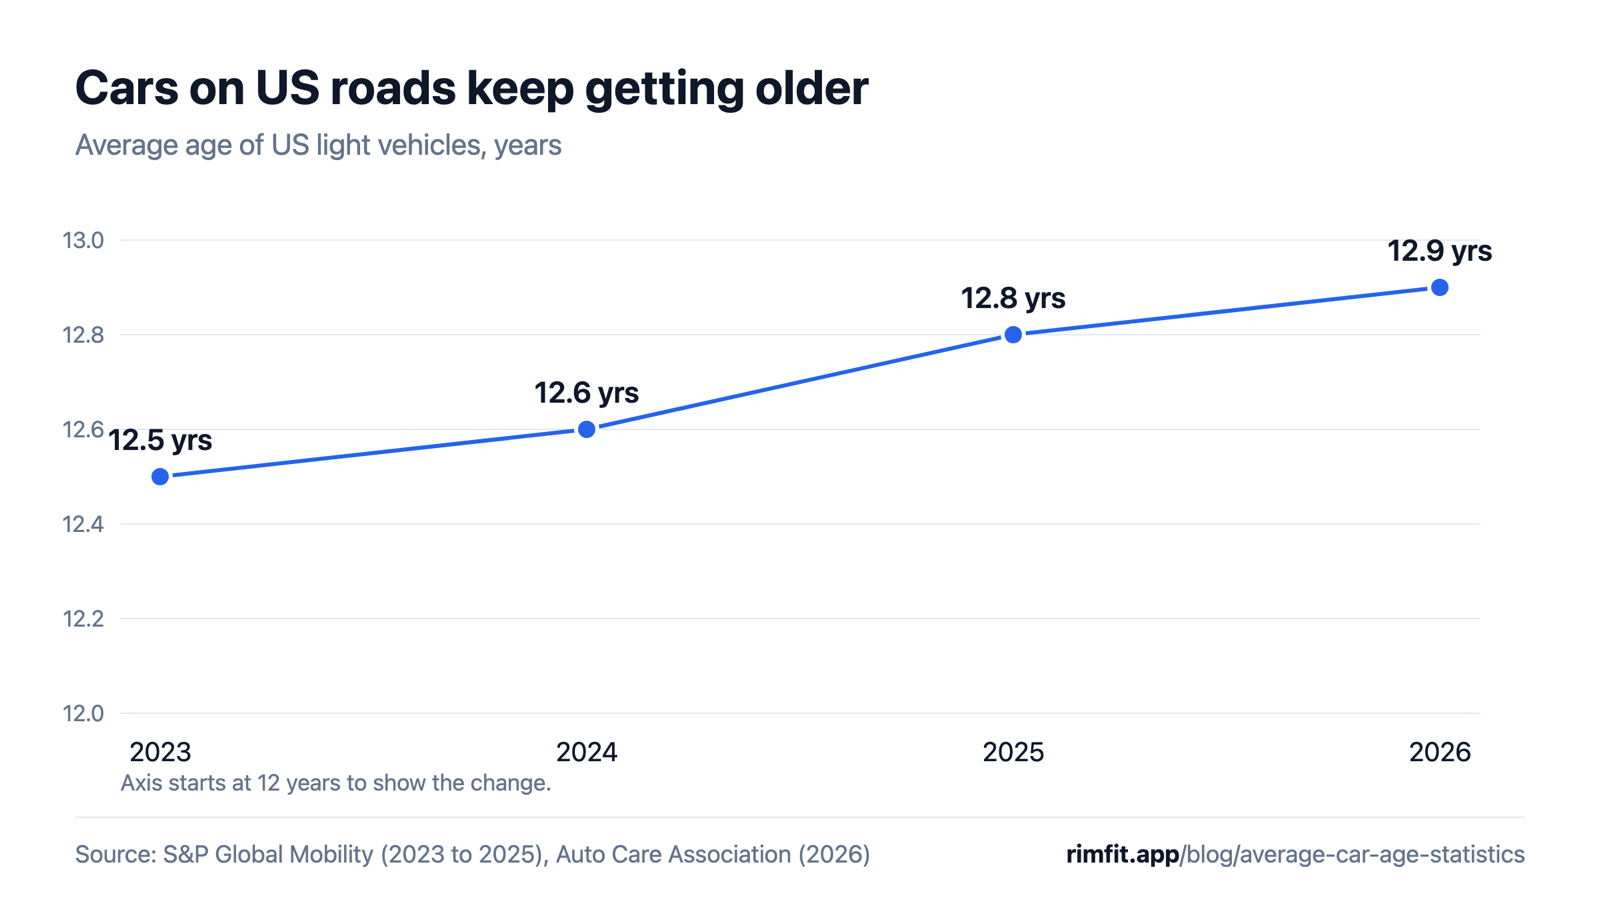
- Average age: 12.9 years, a record. (Auto Care Association, 2027 Auto Care Factbook, Jun 2026)
- In 2025 it was 12.8 years, up two months for the second year in a row. (S&P Global Mobility, May 2025)
- In 2024 it was 12.6 years. (S&P Global Mobility, May 2024)
- In 2023 it was 12.5 years. (S&P Global Mobility, May 2023)
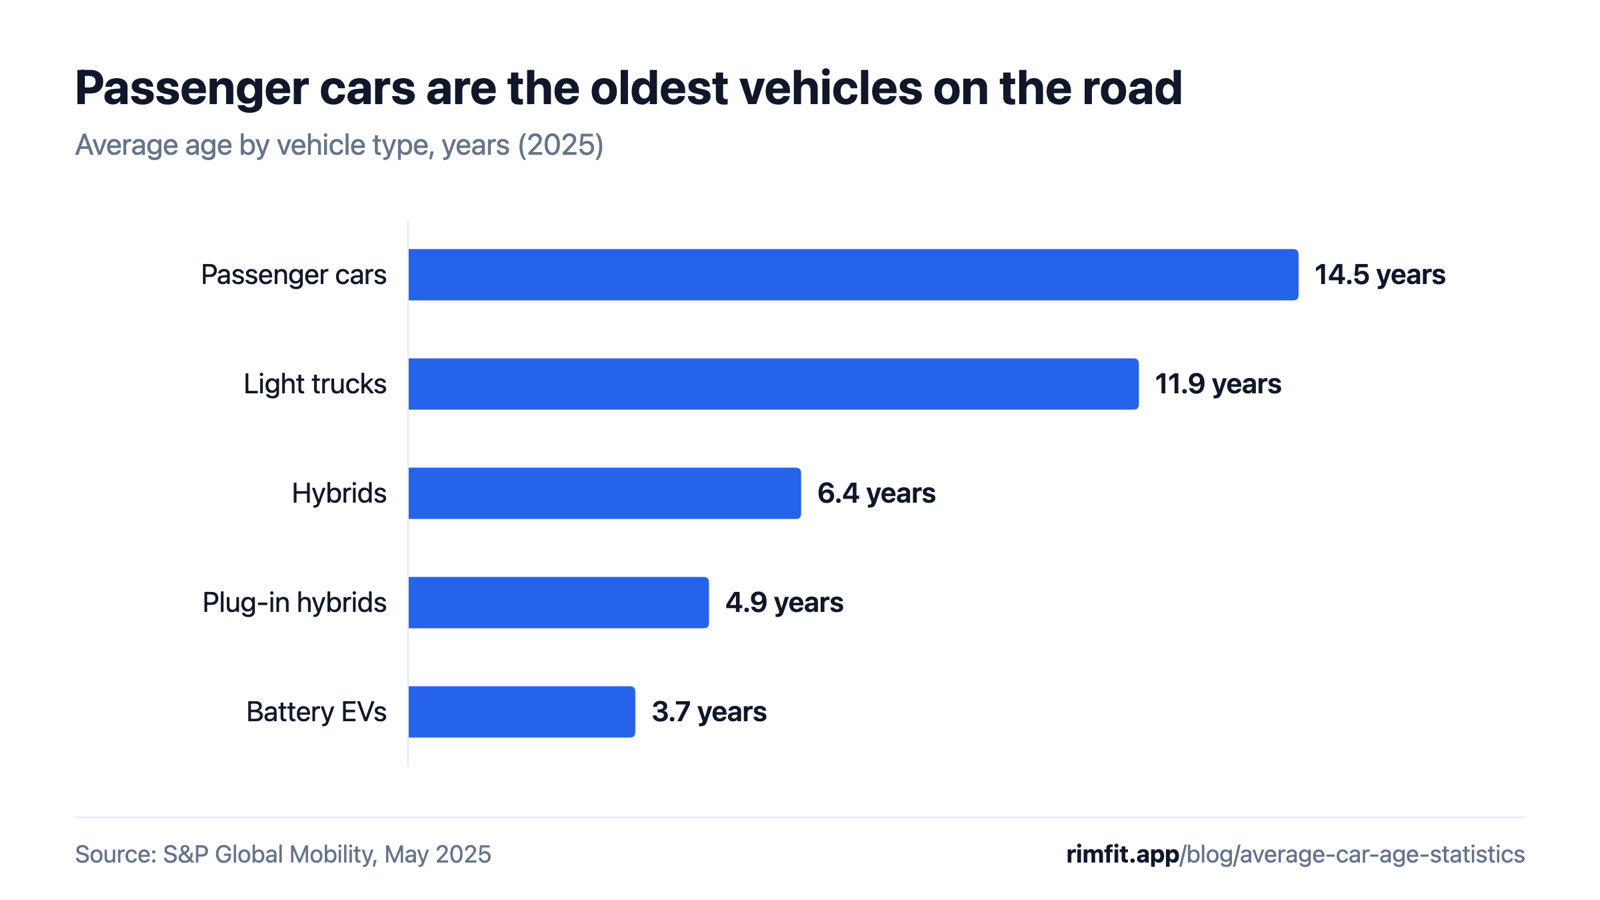
- Passenger cars: 14.5 years. Light trucks: 11.9 years. (S&P Global Mobility, May 2025)
- Battery EVs: 3.7 years. Plug-in hybrids: 4.9. Hybrids: 6.4, down from 6.9. (S&P Global Mobility, May 2025)
How many cars are on US roads?
297.5 million motor vehicles were registered in the US in 2024.
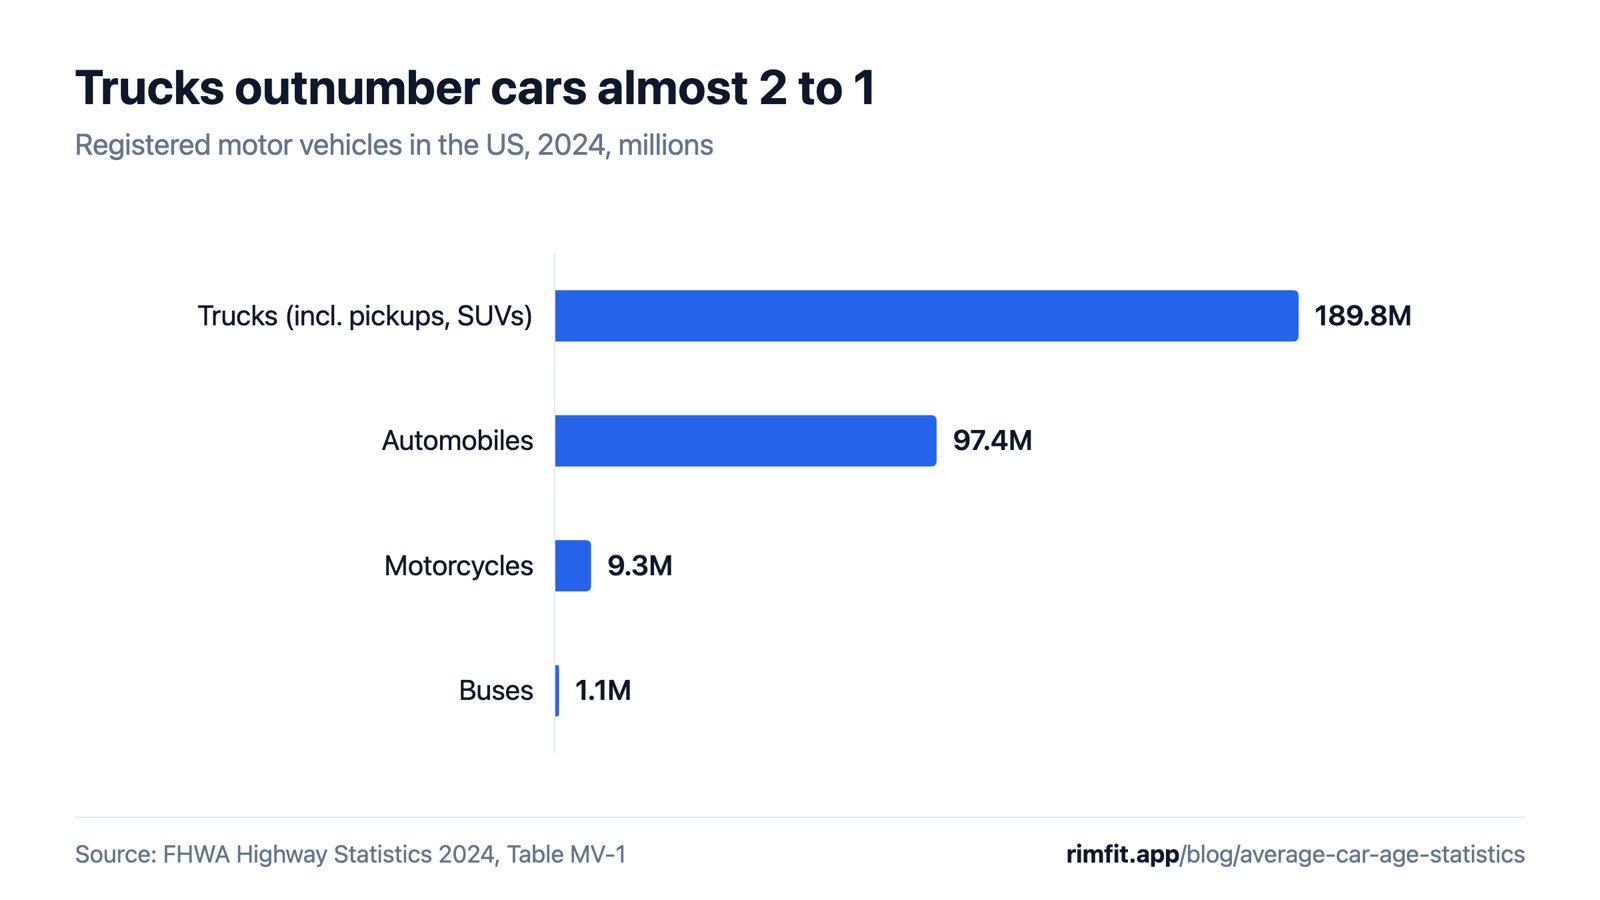
- 297,525,836 registered vehicles in total. (FHWA Highway Statistics 2024, Table MV-1, Jan 2026)
- 97,413,321 automobiles and 189,754,931 trucks. (FHWA Highway Statistics 2024, Table MV-1, Jan 2026)
- 9,261,249 motorcycles and 1,096,335 buses. (FHWA Highway Statistics 2024, Table MV-1, Jan 2026)
- Light vehicles in operation: 289 million, up 3 million in a year. (S&P Global Mobility, May 2025)
- Passenger cars fell below 100 million for the first time since the 1970s. (S&P Global Mobility, May 2025)
- Vehicles are scrapped at a steady rate of 4.5% a year. (S&P Global Mobility, May 2025)
- New vehicle registrations passed 16 million in 2024. (S&P Global Mobility, May 2025)
- The light-vehicle fleet is forecast to pass 301 million by 2029. (Auto Care Association, 2027 Auto Care Factbook, Jun 2026)
Which states have the most cars?
California, Texas and Florida have the most registered vehicles.
- California: 30,940,652. (FHWA Highway Statistics 2024, Table MV-1, Jan 2026)
- Texas: 23,606,401. (FHWA Highway Statistics 2024, Table MV-1, Jan 2026)
- Florida: 19,696,080. (FHWA Highway Statistics 2024, Table MV-1, Jan 2026)
How far do Americans drive?
Americans drove 3.29 trillion miles in 2024, about 11,071 miles per vehicle.
- Total: 3,294,031 million vehicle-miles. (FHWA Highway Statistics 2024, Table VM-1, Feb 2026)
- Average: 11,071 miles per vehicle. (FHWA Highway Statistics 2024, Table VM-1, Feb 2026)
- Cars and smaller light vehicles: 10,812 miles a year at 25.6 mpg. (FHWA Highway Statistics 2024, Table VM-1, Feb 2026)
- Pickups and larger SUVs: 10,707 miles a year at 18.5 mpg. (FHWA Highway Statistics 2024, Table VM-1, Feb 2026)
- Licensed drivers: 239,824,944. (FHWA Highway Statistics 2024, Table DL-22, Feb 2026)
What does a new car cost in 2026?
A new vehicle averaged $50,562 in September 2026, just under the record of $50,614 set in December 2025.
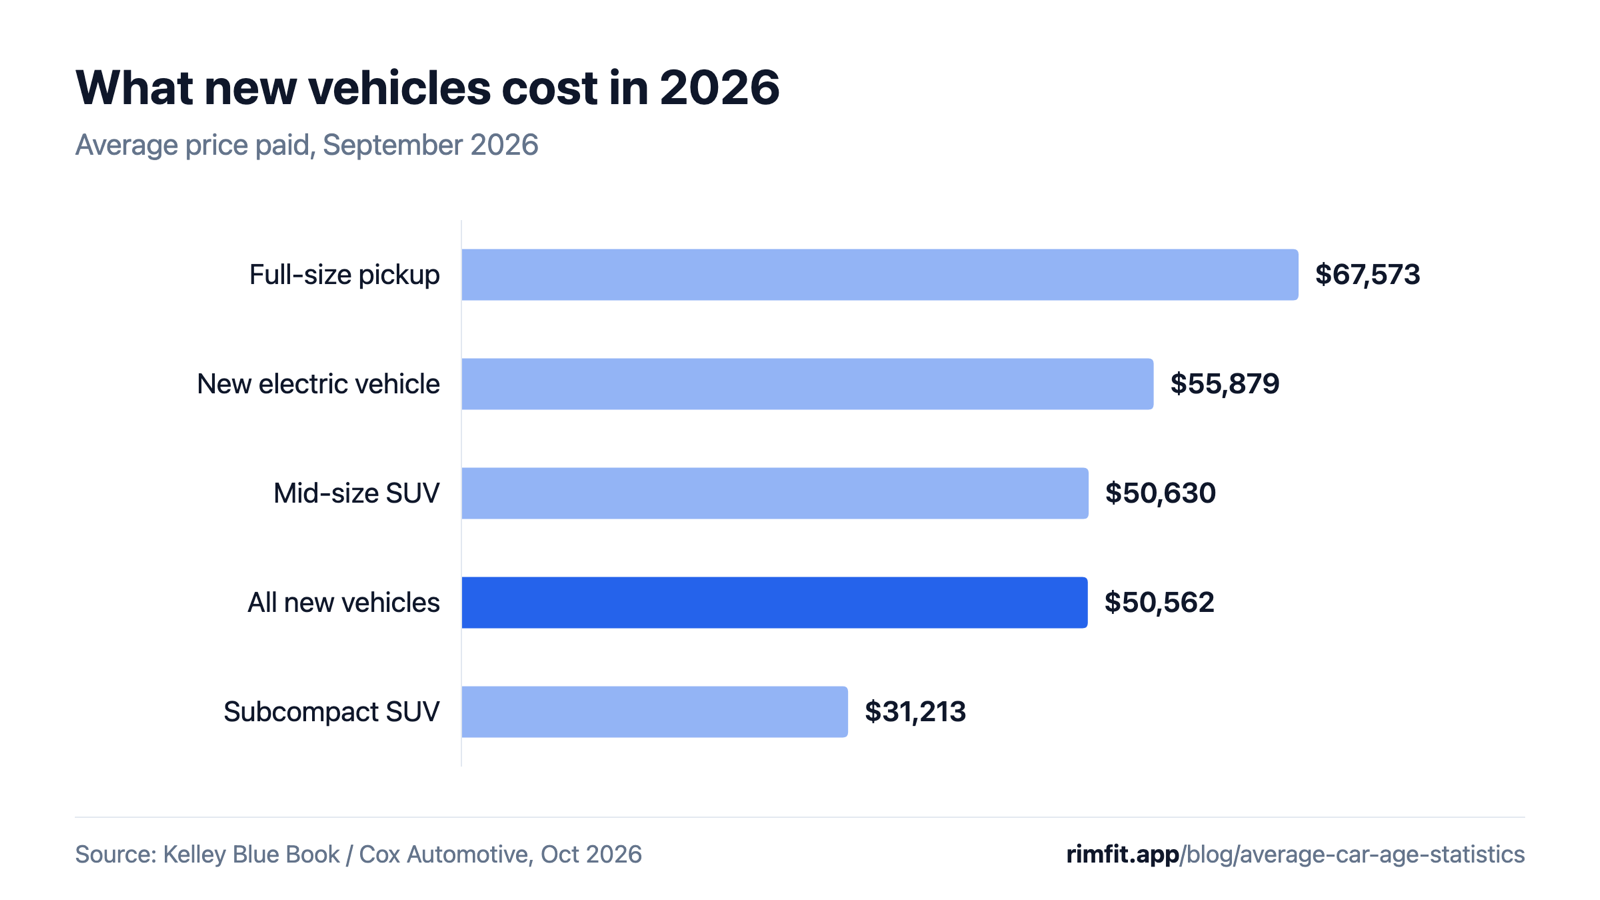
- Average price paid: $50,562, up 0.7% on September 2025. (Kelley Blue Book / Cox Automotive, Oct 2026)
- Average sticker price (MSRP): $52,342. (Kelley Blue Book / Cox Automotive, Oct 2026)
- Discounts averaged 6.6% of the price, about $3,359. (Kelley Blue Book / Cox Automotive, Oct 2026)
- Full-size pickup: $67,573. Mid-size SUV: $50,630. Subcompact SUV: $31,213. (Kelley Blue Book / Cox Automotive, Oct 2026)
- New electric vehicle: $55,879. (Kelley Blue Book / Cox Automotive, Oct 2026)
- Loan rates are around 7.6% for new cars and 11.4% for used cars. (SEMA, 2026 Future Trends Report, 2026)
How much does it cost to own a car?
Owning and running a new vehicle costs $12,863 a year, or $1,071.92 a month.
- $12,863 a year, or $1,071.92 a month. (AAA, Your Driving Costs 2026, Sep 2026)
- Losing value (depreciation) is the biggest cost, at $4,422 a year. (AAA, Your Driving Costs 2026, Sep 2026)
- Based on 34 popular models over 5 years and 75,000 miles. (AAA, Your Driving Costs 2026, Sep 2026)
- The 2025 estimate was $11,577, but AAA changed its method, so the years don't compare directly. (AAA, Your Driving Costs 2026, Sep 2026)
Methodology and sources
We only use numbers from the organisation that produced them: government agencies, industry associations and company research. We opened every source page and checked the number on it before publishing. Lines marked “RimFit calculation” are simple math on the cited numbers so anyone can check them. We review this page every quarter and update the numbers when new reports come out.
- Auto Care Association, 2027 Auto Care Factbook (Jun 2026)
- S&P Global Mobility (May 2025)
- S&P Global Mobility (May 2024)
- S&P Global Mobility (May 2023)
- FHWA Highway Statistics 2024, Table MV-1 (Jan 2026)
- FHWA Highway Statistics 2024, Table VM-1 (Feb 2026)
- FHWA Highway Statistics 2024, Table DL-22 (Feb 2026)
- Kelley Blue Book / Cox Automotive (Oct 2026)
- AAA, Your Driving Costs 2026 (Sep 2026)
- SEMA, 2026 Future Trends Report (2026)
How to cite this page
RimFit. “Average Car Age & Vehicle Ownership Statistics 2026.” Updated October 13, 2026. https://rimfit.app/blog/average-car-age-statistics
Frequently asked questions
What is the average age of a car in the US?
12.9 years, a record, according to the Auto Care Association (2026). Passenger cars average 14.5 years and light trucks 11.9 years (S&P Global Mobility, 2025).
How many cars are registered in the US?
297.5 million motor vehicles were registered in 2024, according to the Federal Highway Administration.
How many miles does the average car drive a year?
11,071 miles per vehicle in 2024, according to the Federal Highway Administration.
Show customers their car — before they buy
RimFit is the AI wheel visualizer built for tire & wheel shops.
RimFit for shops →